Wonderlic Test Percentiles: Score Chart, IQ Context, and NFL Benchmarks
Wonderlic test percentiles can make a raw score feel more useful, but they can also be easy to overread. A raw score tells you how many questions you answered correctly. A percentile estimate tries to show how that result compares with a larger group of test takers. Those are related ideas, not the same thing. If you are preparing for an employment screen, school admissions process, or general Wonderlic-style assessment, the smartest approach is to treat percentiles as context while using practice to improve speed, accuracy, and calm decision-making. WonderlicTest.net is an independent Wonderlic practice platform for that kind of preparation, not an official testing administrator.
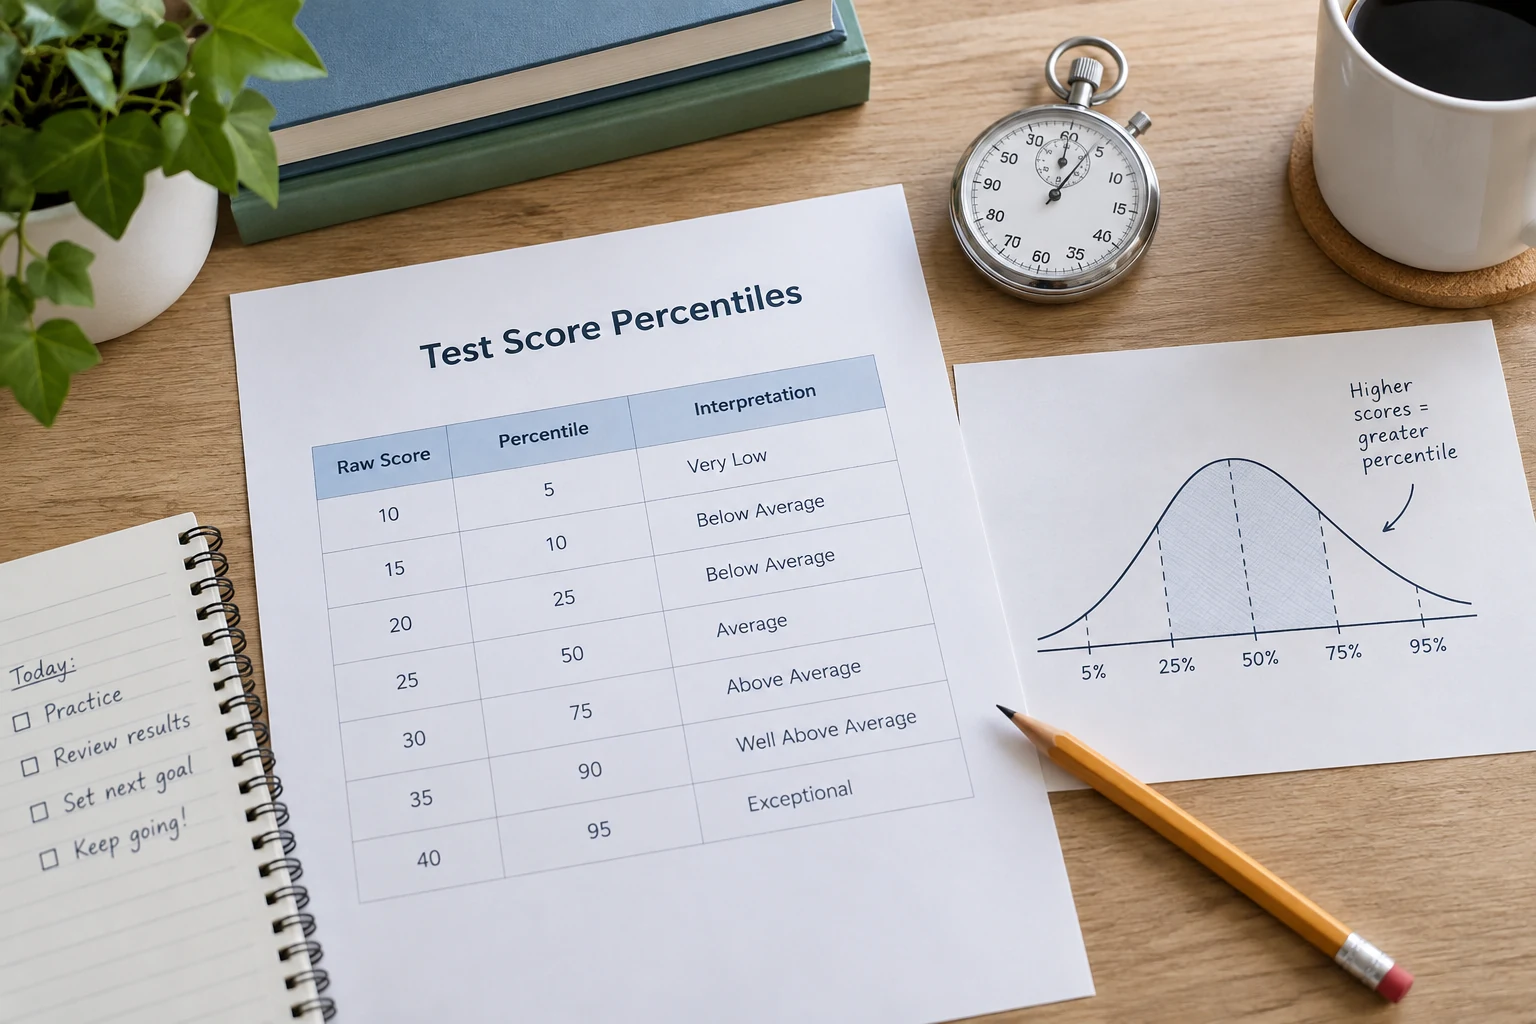
What Wonderlic Percentiles Actually Mean
A Wonderlic percentile is a comparison statement. If a score is described as the 70th percentile, it means the score is estimated to be higher than about 70 percent of the comparison group. It does not mean the test taker answered 70 percent of the questions correctly. On the classic 50-question Wonderlic Personnel Test format, a raw score of 35 means 35 correct answers, while a percentile rank depends on the norm group used to interpret that result.
That distinction matters because percentile tables can vary. A chart built from one population, job family, school group, or practice-test database may not match another chart exactly. Public articles commonly place an average Wonderlic score near 20 out of 50, often around the middle of the distribution. Higher scores usually climb quickly in percentile terms because fewer people reach the upper 30s and 40s under the 12-minute time limit.
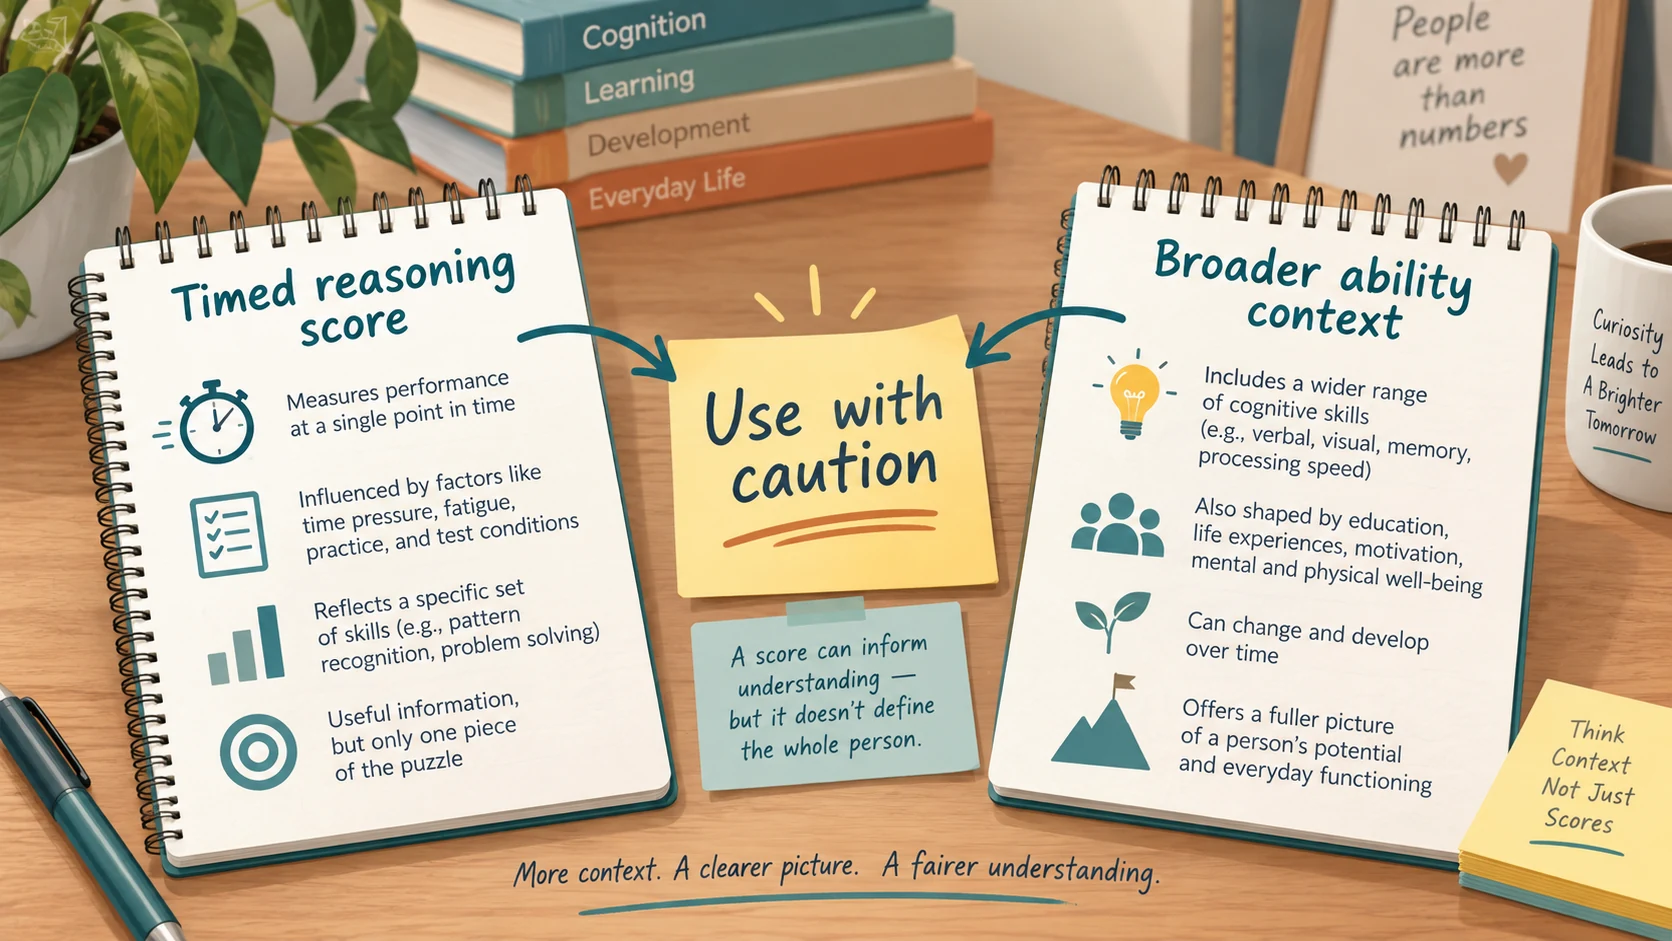
Use percentiles as a directional guide, not a permanent label. A percentile can help you see whether a score is below average, near average, above average, or unusually high. It should not be treated as a full picture of job ability, intelligence, learning potential, or future performance.
Wonderlic Test Score Chart: Raw Score to Percentile
The table below gives a practical, approximate way to read common Wonderlic score ranges. It is designed for preparation and interpretation, not official scoring. Actual percentile rank can shift based on the test version, comparison population, and organization using the assessment.
| Raw score out of 50 | Approximate percentile band | Practical meaning |
|---|---|---|
| 10 or below | Bottom 5-10% | Very low relative to most comparison groups |
| 15 | Around bottom 20-25% | Below average; pace and accuracy need attention |
| 20 | Around 50th percentile | Commonly treated as average |
| 24-25 | Around 65th-75th percentile | Above average in many public charts |
| 27-29 | Around 75th-90th percentile | Strong score range for many roles |
| 30-34 | Around 90th-95th percentile | High score range |
| 35-39 | Around 95th-99th percentile | Very high score range |
| 40 or higher | Top 1-3% | Rare, especially under timed conditions |
| 50 | Extremely rare | A perfect raw score |
The key pattern is compression at the top. Moving from 20 to 25 may represent a meaningful jump, but moving from 35 to 40 can be much rarer because the test rewards fast, accurate work across mixed question types. That is why a Wonderlic test score chart should be read in bands. A one-point difference may matter less than the broader range it falls into.
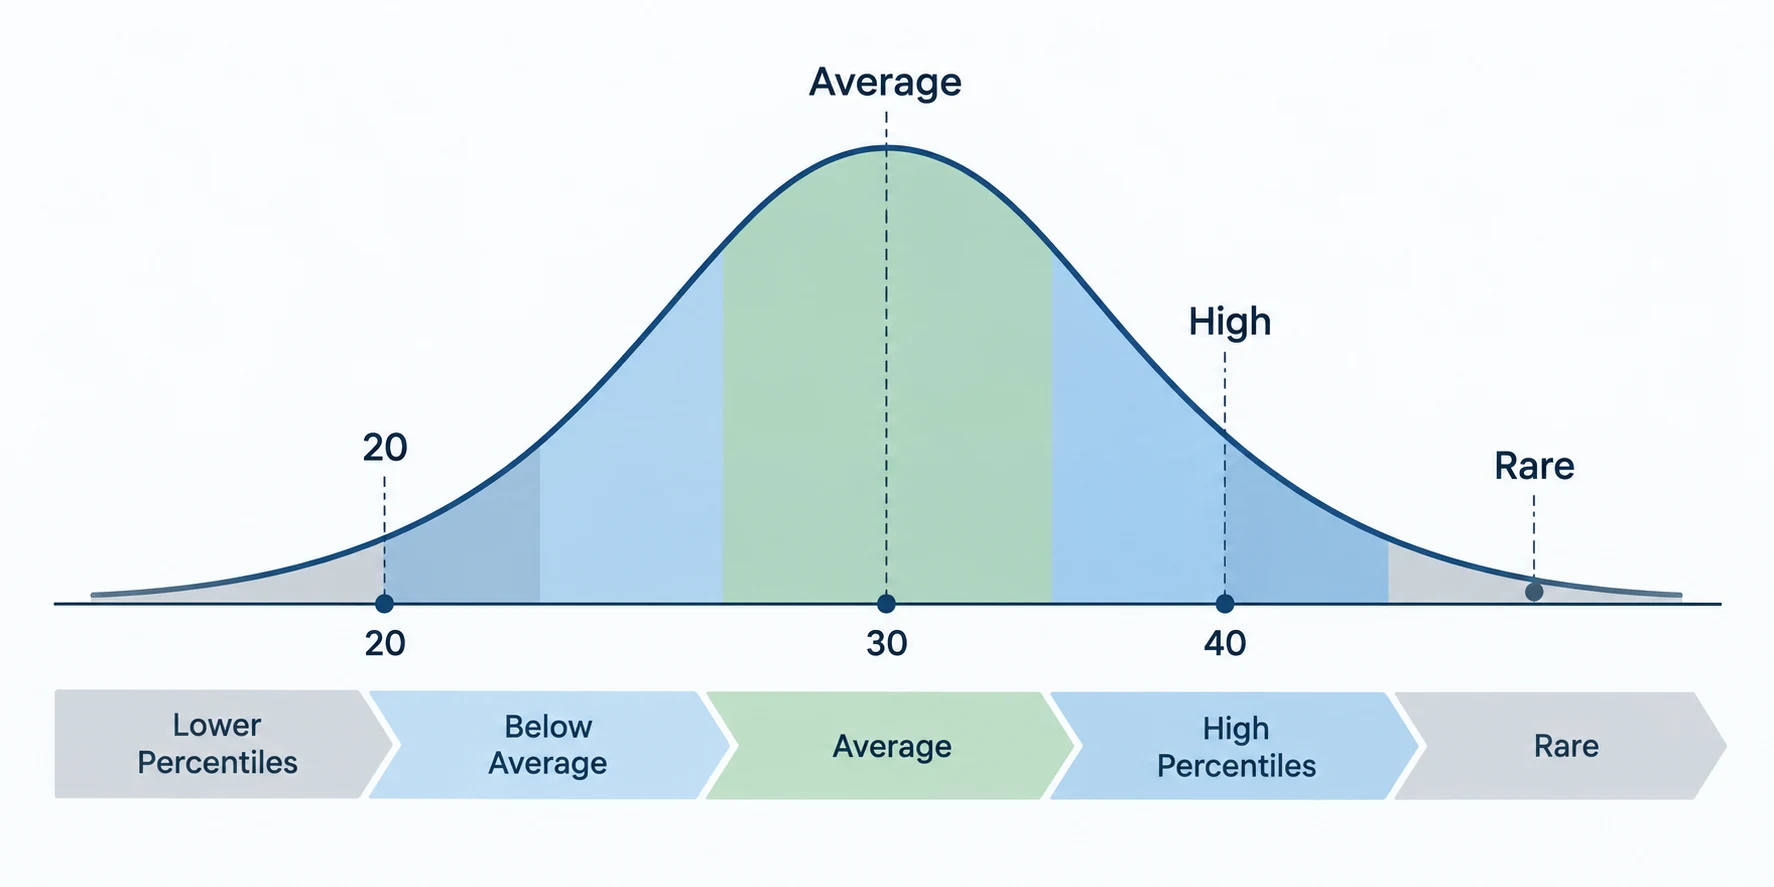
Why a 20 Can Be Average but Still Useful
Many people search for Wonderlic test percentiles because they want to know whether a score is "good." The better question is good for what. A score around 20 is often described as average on the traditional 50-question version. For some roles, that may be acceptable. For other roles that emphasize rapid problem-solving, quantitative reasoning, or complex instructions, the target may be higher.
This is where percentiles help. A raw score of 20 says you answered about 40 percent of the questions correctly on a 50-item version. A percentile estimate says that result may sit near the middle of the comparison group. In a test where many people do not finish all items, a raw percentage does not tell the full story. Speed pressure is part of the measurement.
If you are using a timed Wonderlic practice environment, review more than the final number. Look at which question types slowed you down, where guessing became random, and whether you spent too long on a small number of items. Percentile movement usually comes from better triage as much as from learning new math or vocabulary.
30 Question Wonderlic Test Scores and WPT-Q Conversions
Some Wonderlic-style formats use 30 questions instead of 50. Public prep resources often connect this shorter format with the WPT-Q, a quick version where the result may still be scaled to a 50-point score. A simple way to understand the idea is that each correct answer on a 30-question version can represent about 1.66 scaled points, because 30 items are being mapped onto a 50-point scale.
For example, 12 correct answers on a 30-question version would scale to roughly 20. Fifteen correct answers would scale to about 25. Eighteen correct answers would scale to about 30. This is a useful mental model, but you should not assume every employer, school, or test provider uses the same public conversion. Always read the instructions for the specific assessment you are taking.
The most common mistake is comparing a 30-question raw count directly with a 50-question raw score. A 24 on a 30-item form is not the same thing as a 24 on a 50-item form if the shorter form is scaled. When someone talks about a score, ask whether they mean raw correct answers, a scaled Wonderlic score, or a percentile rank.
Wonderlic Scores to IQ: Useful Shortcut or Risky Myth?
Searches like "29 Wonderlic score to IQ," "32 Wonderlic score to IQ," and "38 Wonderlic score to IQ" are popular because people want a familiar frame of reference. You may see rough shortcuts online, such as multiplying the Wonderlic score by five or treating a score near 20 as roughly average IQ. These shortcuts are easy to remember, but they are not the same as a professionally administered IQ assessment.
The Wonderlic is a fast cognitive ability test with verbal, numerical, spatial, and reasoning items. It is heavily shaped by time pressure. IQ tests usually cover a wider set of tasks, are administered differently, and are interpreted with different norms. That means a Wonderlic score can overlap with general cognitive ability, but it should not be used as a personal identity statement.
A more balanced way to read the numbers is this: 20 is commonly treated as average, scores in the high 20s and low 30s are often above average, and scores in the upper 30s or 40s are unusual. Beyond that, focus on what you can control. Practice can improve familiarity, pacing, question selection, and confidence.
Highest Wonderlic Scores and NFL Benchmarks
NFL Wonderlic scores get attention because they give familiar names to an otherwise abstract scale. Reported examples often list Tom Brady at 33 and Rob Gronkowski at 32. Some public lists also discuss very high or perfect scores, including the often-cited perfect 50 by Pat McInally. These examples are interesting, but they should be read carefully.
First, many NFL scores are reported historically rather than published through one official public database. Second, football performance depends on film study, processing under live pressure, physical tools, coaching, health, teamwork, and role fit. A score can be one data point without being a prediction of greatness. That is why the highest QB Wonderlic scores make good trivia but weak career forecasts.
The average Wonderlic score NFL discussions also vary by source. Some articles place the broad NFL average around the low-to-mid 20s, while quarterback averages are often discussed separately. For test prep, the lesson is simple: percentiles are useful for understanding rarity, not for ranking human value. A 33 is strong. A 20 can still be functional. A famous athlete's number does not define what your target should be.
How to Use Percentiles When You Practice
Percentiles become more useful when you connect them to practice behavior. Instead of asking only, "What percentile is my score?" ask what changed between attempts. Did you answer more items? Did careless errors drop? Did you spend less time on word problems? Did you skip hard items earlier instead of getting stuck?
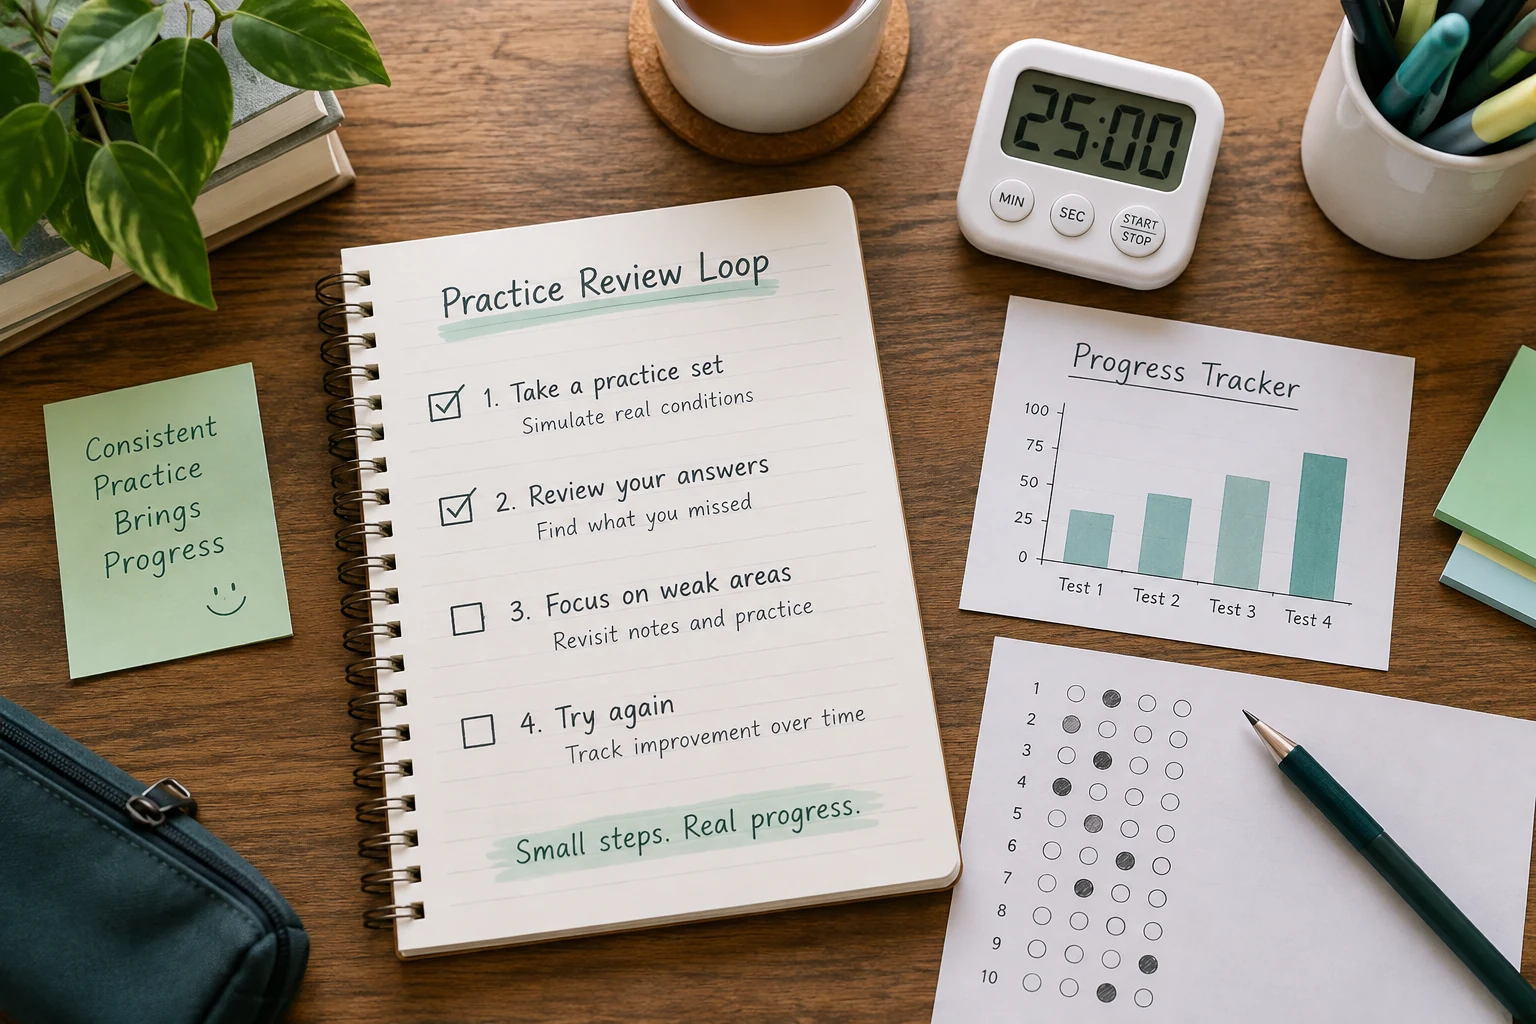
Use this simple review loop after each practice set:
- Record your raw score, unfinished questions, and guessed questions.
- Sort mistakes into speed, knowledge, reading, and attention categories.
- Choose one fix for the next session, such as faster arithmetic setup or earlier skipping.
- Compare score bands over several attempts instead of reacting to one result.
- Stop treating percentile estimates as exact if the practice source does not explain its norm group.
This loop turns a static score into preparation data. It also lowers the pressure around a single attempt. If your score rises from 20 to 24, the more important insight may be that your pacing improved. If your score stays flat but errors become more concentrated in one topic, you now have a clearer practice target.
Turning a Percentile Into a Smarter Prep Plan
The best use of Wonderlic test percentiles is not comparison for its own sake. It is planning. If your practice score is below the range you want, work on the highest-return constraints first: time awareness, basic arithmetic fluency, vocabulary shortcuts, and question triage. If your score is already above average, shift toward consistency under strict timing and reducing preventable misses.
WonderlicTest.net can support a practice-first score review by giving you a Wonderlic-style environment where the score is only the beginning of the reflection. Read your result as a snapshot, not a final judgment. Then ask which two or three behaviors would make the next attempt cleaner.
Percentile charts are most helpful when they create perspective. They can show why a 30 is strong, why a 40 is rare, and why a 20 may be more respectable than a raw percentage suggests. But the most practical takeaway is still ordinary and actionable: practice under the clock, review your patterns, and use score bands to guide your next round of preparation.
FAQ
What's a good Wonderlic test score?
A good Wonderlic score depends on the role, school, or selection process using the assessment. In many public charts, 20 is treated as average, the high 20s are above average, and 30 or higher is strong. For preparation, compare your score with the target range for your situation instead of assuming one universal cutoff.
What percentile is a 30 on the Wonderlic?
A 30 is often placed around the high 80s to low 90s in public percentile charts, but the exact percentile depends on the norm group. It is safer to describe 30 as a high score rather than claim one fixed percentile for every setting.
What does a 32 Wonderlic score convert to in IQ?
Online shortcuts sometimes map a 32 to an above-average IQ estimate, but that should be treated cautiously. The Wonderlic is timed and narrower than a full IQ assessment. A score of 32 is best described as a strong Wonderlic result, not a formal IQ score.
How do 30 question Wonderlic test scores work?
Some shorter Wonderlic-style tests scale 30 questions onto a 50-point score. In that model, each correct answer is worth about 1.66 scaled points. For example, 15 correct answers could scale to about 25. Check the specific test instructions before comparing scores.
What was Tom Brady's Wonderlic score?
Tom Brady is commonly reported to have scored 33 on the Wonderlic. That is above average and strong, but it is only one historical data point. NFL performance depends on many skills and conditions beyond a short cognitive test.
What did Gronk score on the Wonderlic test?
Rob Gronkowski is commonly reported to have scored 32. That is a strong score in most public Wonderlic score charts. As with other NFL examples, it should be read as interesting context rather than a full measure of football intelligence.
What was Travis Kelce's Wonderlic score?
Travis Kelce's Wonderlic score is not as consistently documented in widely reliable public sources as some older combine examples. If you see a number online, treat it as reported trivia unless the source explains where it came from.
Are Wonderlic percentiles official?
Only the organization administering or reporting the assessment can define the official norm group for that result. Public percentile charts are useful for preparation, but they are approximate. Use them to understand score ranges, not as a final authority.